The Forensic Audit Report
Most Senior Living operators cannot answer a simple question: 'How many active phone lines do you have across your 15 communities?'
We solve this visibility gap. Our deliverable is not just a savings proposal; it is a forensic inventory of your entire technology estate. Whether you choose to move forward with our recommendations or not, this Audit Report is yours to keep—giving your finance team total clarity for the first time.
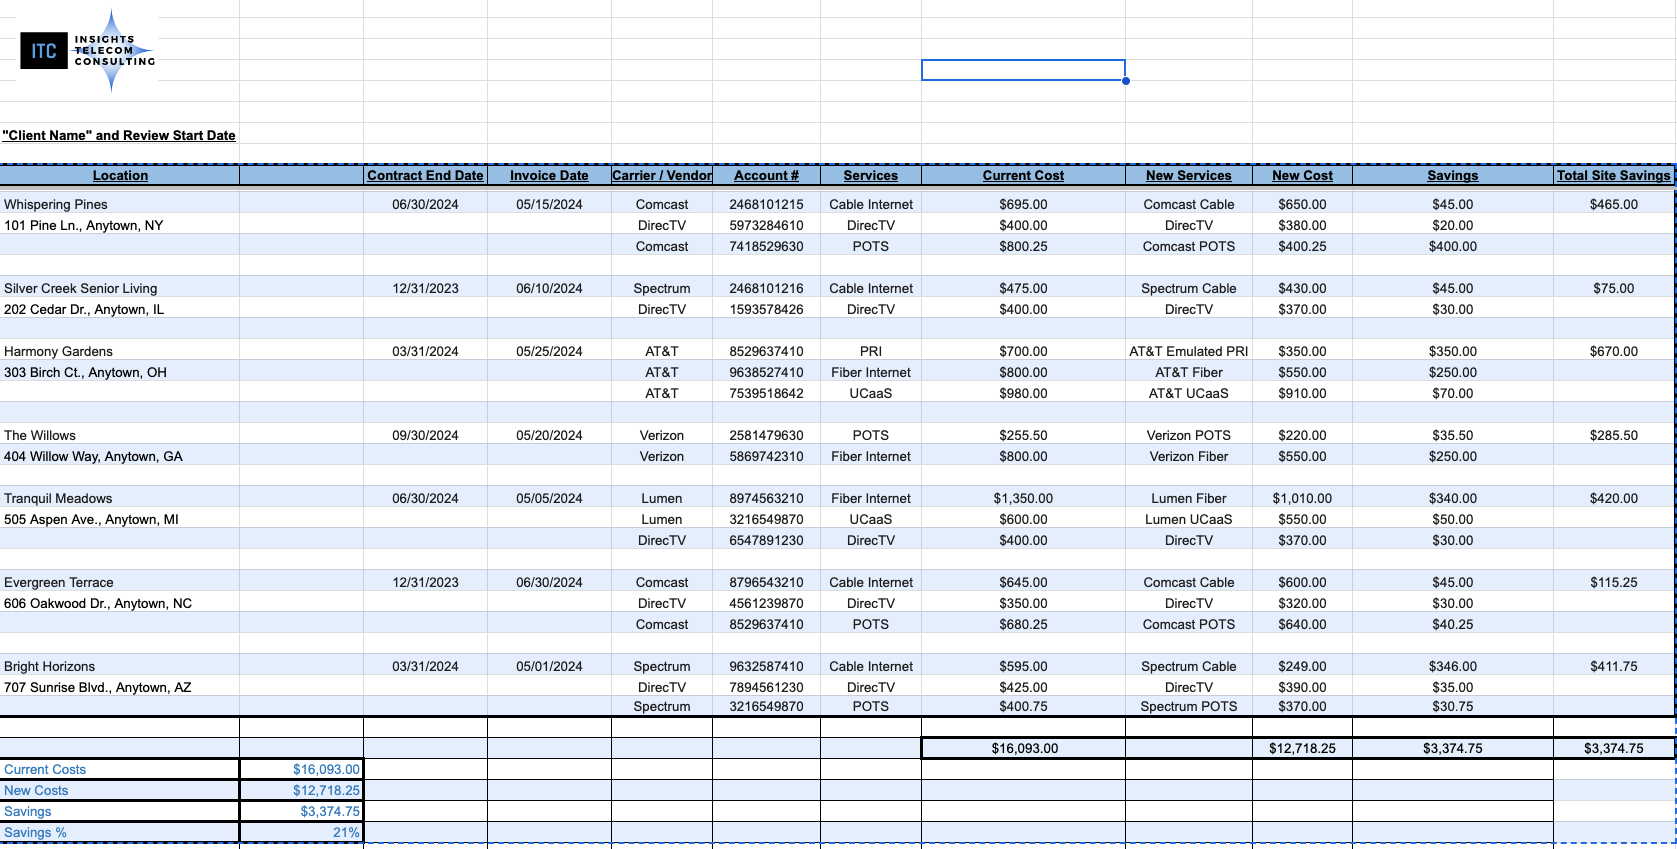
Forensic Audit report Example:
-
What you get: A forensic catalog of every active service, circuit ID, and phone number billing to your accounts.
Why it matters: We often find communities paying for "Ghost Lines"—analog copper lines for fax machines or elevators that were disconnected years ago. We map every billing line item to a physical location.
-
What you get: A line-by-line comparison of your current "Retail Rates" versus the "Wholesale Benchmarks" in our proprietary Senior Living database.
Why it matters: You see exactly how much you are overpaying compared to a community of similar size down the street. We expose the "Loyalty Tax" carriers charge long-term customers.
-
What you get: A summary of every contract expiration date, auto-renewal clause, and termination liability.
Why it matters: CFOs hate surprises. We flag exactly which contracts are auto-renewing in the next 90 days so you can stop the cycle before it locks you in for another 3 years.
-
What you get: A literal roadmap showing three columns: Current Spend, Optimized Spend, and Net Savings.
Why it matters: This isn't a projection; it's a quote. The savings shown here are executable immediately. You sign off on the line items you want, and we handle the rest.

Eliminates AP Friction: Your AP team stops guessing which GL code to assign to a mystery Comcast bill. We map every cost to the correct property.
Audit-Ready Data: When your annual financial audit comes, you have a perfect record of your technology liabilities.
Negotiation Leverage: You stop negotiating from a place of guessing and start negotiating with hard data.
Why Finance Teams Love This Report

Take the "One-Bill" Challenge
You don't need to hand over your entire portfolio to see if we are right.
Send me just one invoice from any provider. I will benchmark it against our wholesale database and tell you within 24 hours if you are overpaying.
If I find waste: We proceed to a full audit.
If I don't: You get the peace of mind that your rates are perfect.
__________________________________________________________________________________________________________________________________________________________________